Make Smarter Decisions with Business Intelligence in Ethiopia
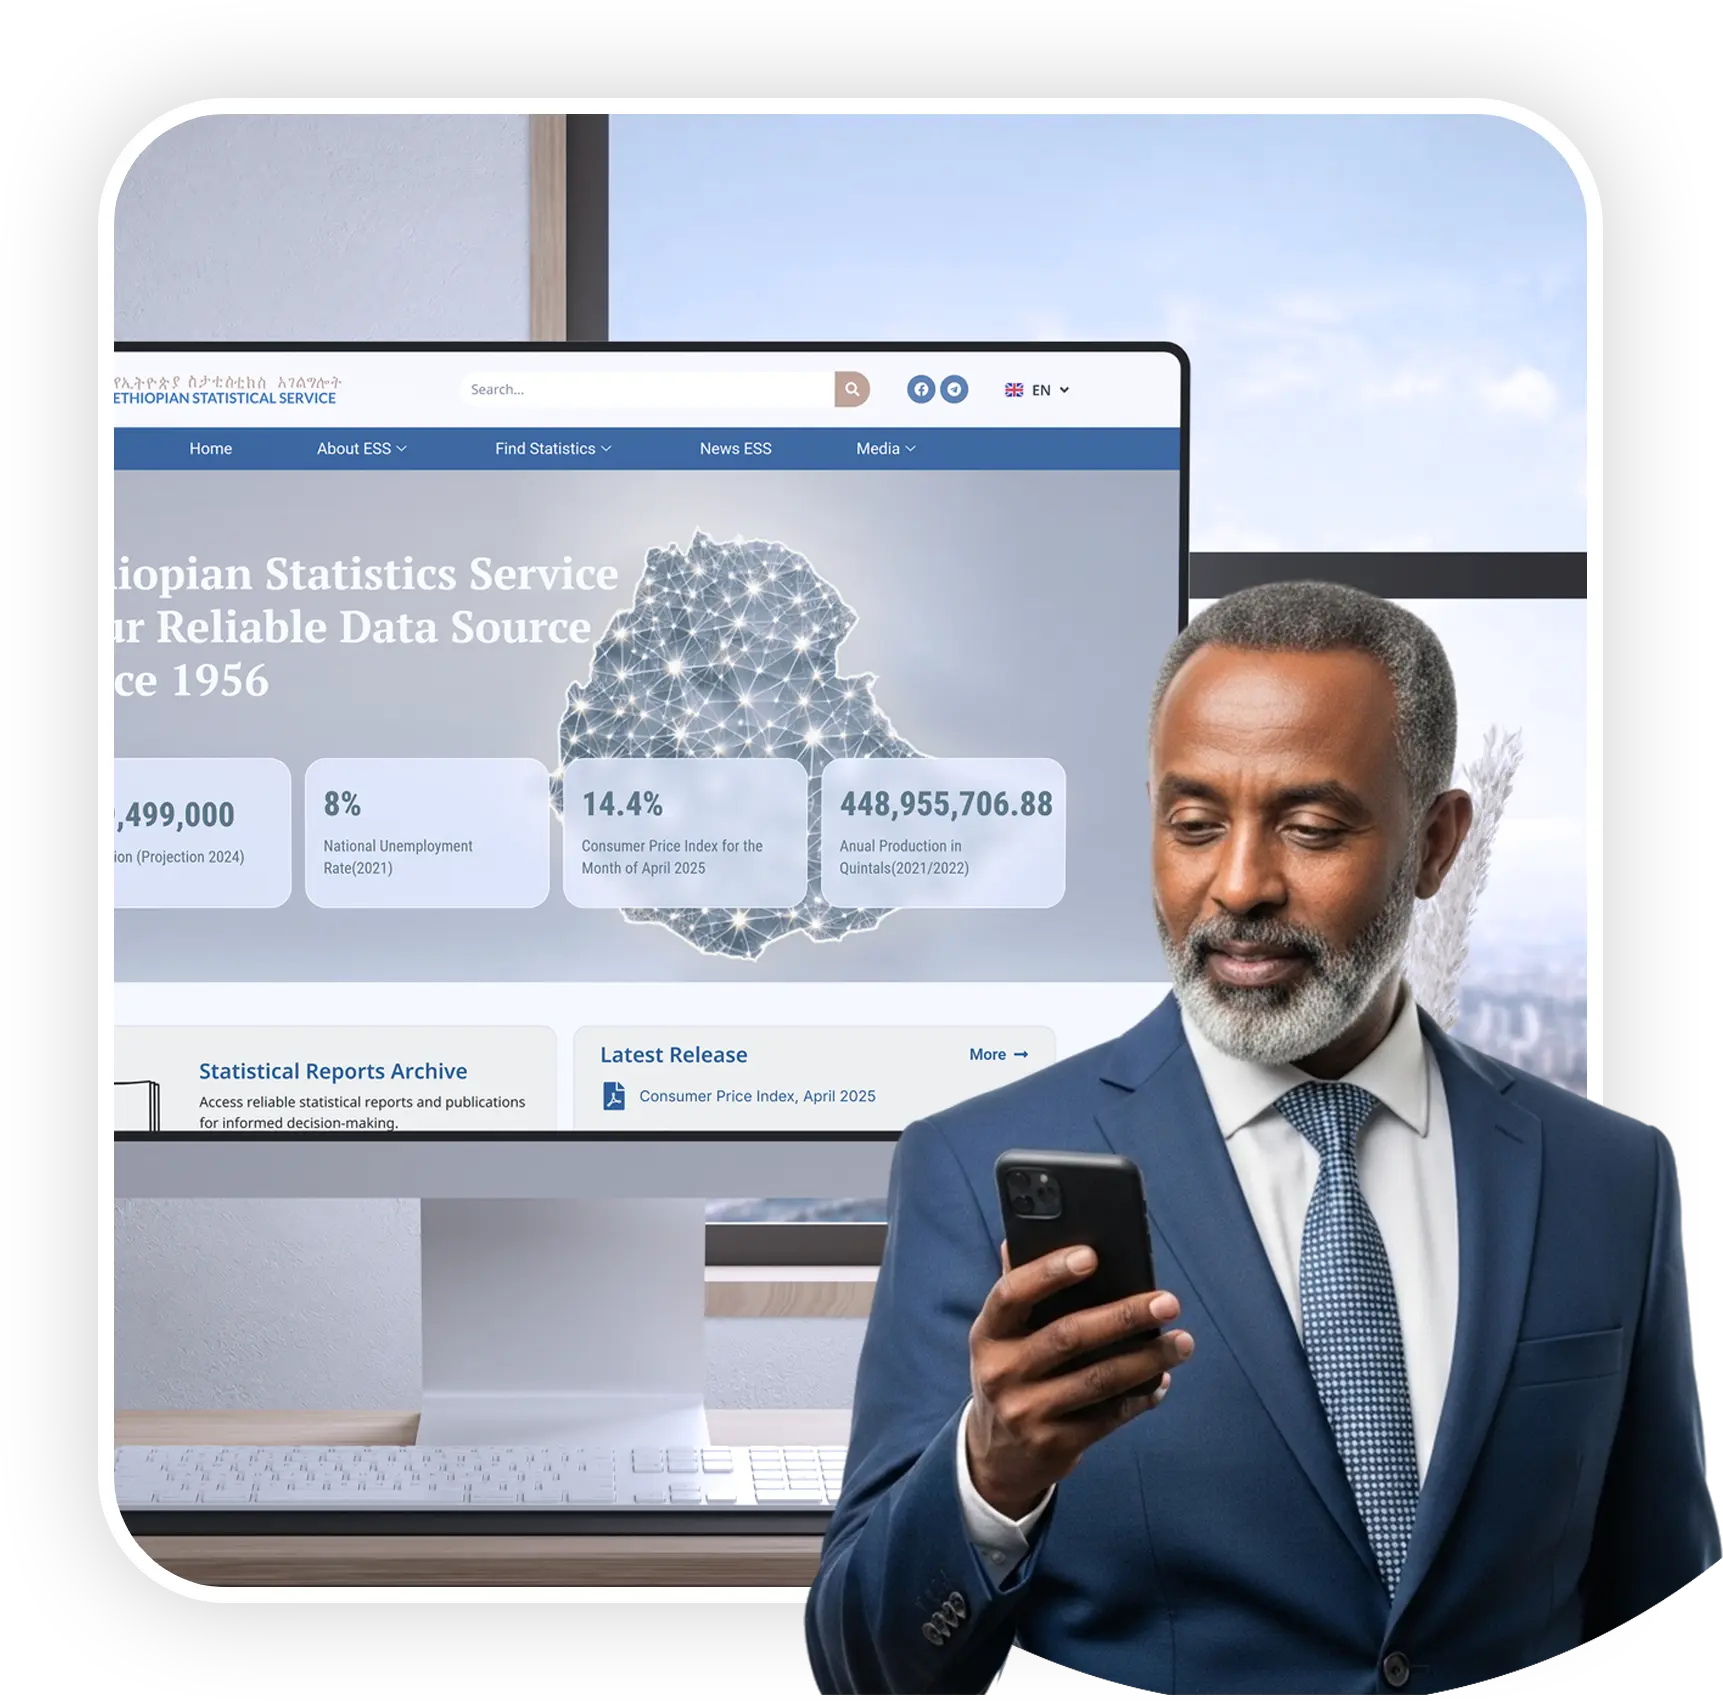
360Ground is a data analytics company in Addis Ababa that helps you harness the power of your data, turning raw numbers into real business value. From robust data pipelines and warehouses to Power BI and ERP dashboards, automated management reports and machine learning models, we support you through every stage of your data journey. We built CPI and inflation dashboards for the Ethiopian Statistics Service, KPI dashboards for MInT’s National Open Data Exchange and spatial dashboards for the Ministry of Agriculture. Whether you are just getting started or scaling your analytics, we deliver intelligent, scalable and secure solutions that report in birr and the Ethiopian calendar.
Interactive Power BI and custom dashboards and visual reports that make complex data easy to understand and act on, with drill-down, role-based views and light pages for slow connections.
ERP Dashboards: Odoo, ERPNext, Dynamics 365
Real-time KPI dashboards that read live transactions from your ERP, built by an Odoo official implementation partner and Microsoft Dynamics 365 implementation partner.
Automated Management & Donor Reporting
Replace monthly Excel reports with scheduled executive, KPI and donor reports in birr and the Ethiopian fiscal year, for enterprises, banks, NGOs and government programmes.
Data Warehousing, ETL & Big Data Processing
Structured data infrastructure with automated extraction, transformation and loading, plus scalable processing of massive volumes of structured, unstructured and spatial data from many systems.
Machine Learning & Predictive Analytics
Data analysis, statistical consulting and intelligent models that identify patterns, predict outcomes and inform strategic decisions, from exploratory analysis to production data science projects.
Real-Time Analytics & Data Governance
Stream data processing for immediate insights, plus frameworks that ensure data quality, security and regulatory compliance, including Personal Data Protection Proclamation No. 1321/2024.
Case Studies
Every project is a journey, and we measure success by the results our clients achieve. From MVPs that disrupt industries to enterprise solutions that scale globally, these stories show how we transform ideas into market-leading solutions.
How much does a Power BI dashboard cost in Ethiopia?
The cost depends on how many data sources must be connected, how clean the data is, the number of dashboards and users, and how often the data refreshes. Connecting and cleaning data is usually the largest share of the work. Licences are a separate line: Power BI usually needs Microsoft licences for people who view shared reports, while dashboards built in Odoo or ERPNext run on the ERP you already have. We price after a short review of your current reports and data sources.
Power BI or ERP dashboards: which do we need?
If most of your numbers already live in one ERP such as Odoo, ERPNext or Microsoft Dynamics 365, start with dashboards inside the ERP: they read live transactions with no extra integration. Choose Power BI when you need to combine several systems, such as ERP, banking systems, spreadsheets and survey data, or need advanced modelling and sharing. As an Odoo official implementation partner and a Microsoft Dynamics 365 implementation partner, 360Ground builds both and connects them where needed.
Why do our departments report different numbers?
Usually because each department keeps its own spreadsheet, extracted at different times and using different definitions of the same measure, such as when a sale counts or which exchange rate applies. The fix is one agreed set of KPI definitions and dashboards that read from a single source, such as your ERP or a data warehouse, refreshed automatically. We start by tracing each report back to its source, then agree definitions with finance and operations, so every department sees one version of the truth.
Can dashboards work on slow or unreliable internet?
Yes, if they are designed for it. We keep pages light, pre-aggregate large data sets on the server, load detail only when a user drills down, and schedule refreshes so dashboards do not query source systems on every view. The National Open Data Exchange dashboards we built for the Ministry of Innovation and Technology were designed for mobile use, Amharic and English, and low-bandwidth performance. Scheduled email reports also put the key numbers in managers’ inboxes without opening a dashboard.
Can you report in the Ethiopian calendar and in birr?
Yes. We build a date table that maps every Gregorian date to its Ethiopian calendar date and fiscal year, which starts on Hamle 1 in early July, so reports can be filtered by Ethiopian month, quarter or fiscal year. Amounts are shown in birr, with US dollar views converted at National Bank of Ethiopia reference rates where needed. Our own 360 Data platform already lets users read fiscal years in either calendar and view amounts in ETB or USD.
How long does a dashboard project take?
A focused project covering one department’s key reports, with data in one system, is measured in weeks rather than months. Timelines grow with the number of data sources, the cleaning needed and the time taken to approve KPI definitions. We work in short sprints: agree KPIs and sources, build a first dashboard on your real data, refine it with users, then automate refresh and hand over with training. Larger programmes are phased, like the ESS market-price system that now produces CPI and inflation reports automatically.